Android Memory Leaks Detection & Debugging | Appxiom
Detect and debug memory leaks in Android apps during development and testing. Appxiom helps teams identify memory issues and improve app stability.
Detect memory leaks in Android apps during development and testing
What is Memory Leak in Android apps?
A memory leak in an Android app is a programming issue where the app fails to release unused memory, causing the app to consume more and more memory over time, leading to performance degradation and eventual crashes. It can negatively impact user experience and should be addressed by developers to ensure the app runs smoothly.
Memory leaks can occur due to various reasons such as incorrect use of callbacks or listeners, improper handling of object references, or issues with garbage collection. In debug and testing mode, memory leaks can become more apparent due to the increased usage of memory analysis tools. These tools can help developers identify and locate memory leaks, allowing them to take appropriate actions to fix them.
It is crucial for developers to regularly monitor their app's memory usage and address any memory leaks as soon as possible. Failure to do so can lead to issues such as slow performance, crashes, and negative user feedback. By implementing good coding practices and utilizing memory analysis tools, developers can effectively prevent and fix memory leaks in their Android applications.
Reasons for Memory Leak in Android apps in debug and testing mode
Memory leaks in Android applications during debug and testing mode can be caused by various factors. The reasons include:
- Incorrect management of object references: This occurs when objects are not released when they are no longer needed, leading to a continuous accumulation of unused objects in memory.
- Improper use of static variables: This can cause objects to remain in memory even after they are no longer required, contributing to memory leaks.
- Using too many resources without releasing them: Resources such as bitmaps, cursors, or file streams can lead to memory leaks when they continue to occupy memory space without being utilized.
How Appxiom Detects Memory Leaks in Debug and Testing
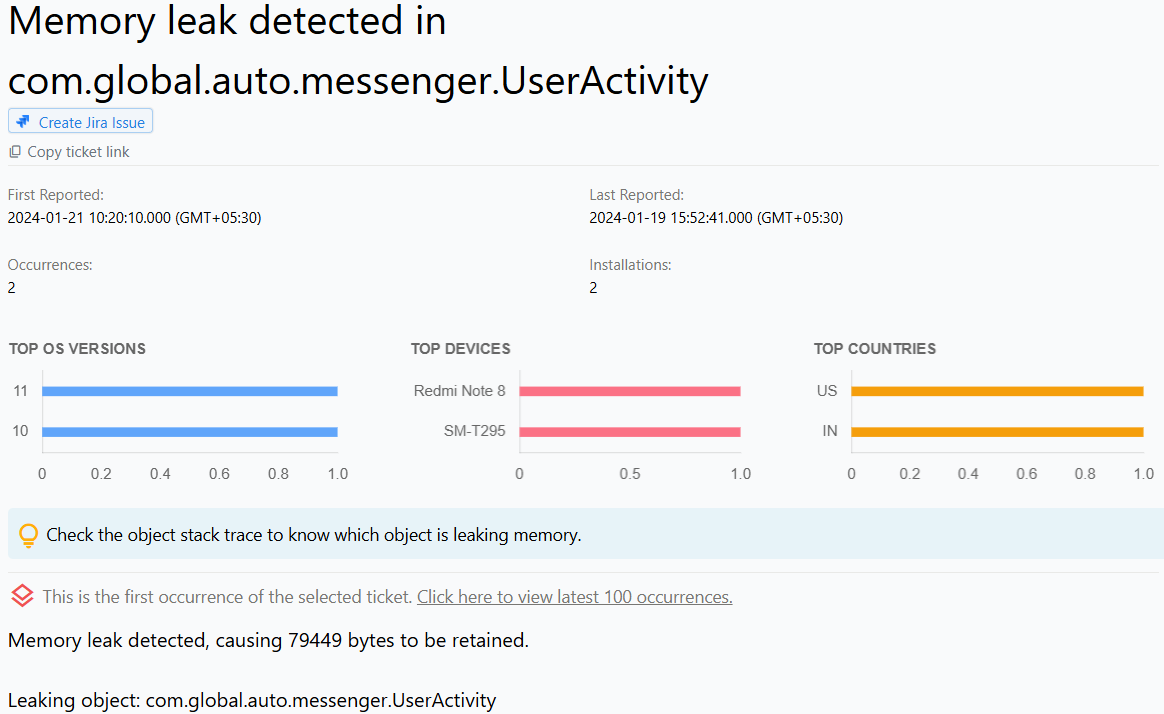
Appxiom helps developers detect memory leaks during development and testing by monitoring memory usage and tracking object references in real time. When a memory leak is detected, Appxiom provides:
- Activity Name: The specific activity where the leak occurred
- Class Stack: A detailed stack trace showing the sequence of classes and objects leading to the leak
- Memory Usage Data: Information about memory growth and potential leaks
This information allows developers to quickly identify the exact object or code path causing the leak, making it easier to fix issues before releasing the app to production.
How do we use the information in the screenshot to fix Memory Leaks in Android apps in debug and testing mode?
The issue report provides the name of the activity where the leak occurred, along with the class stack. The class stack enables developers to identify the exact object causing the leak.